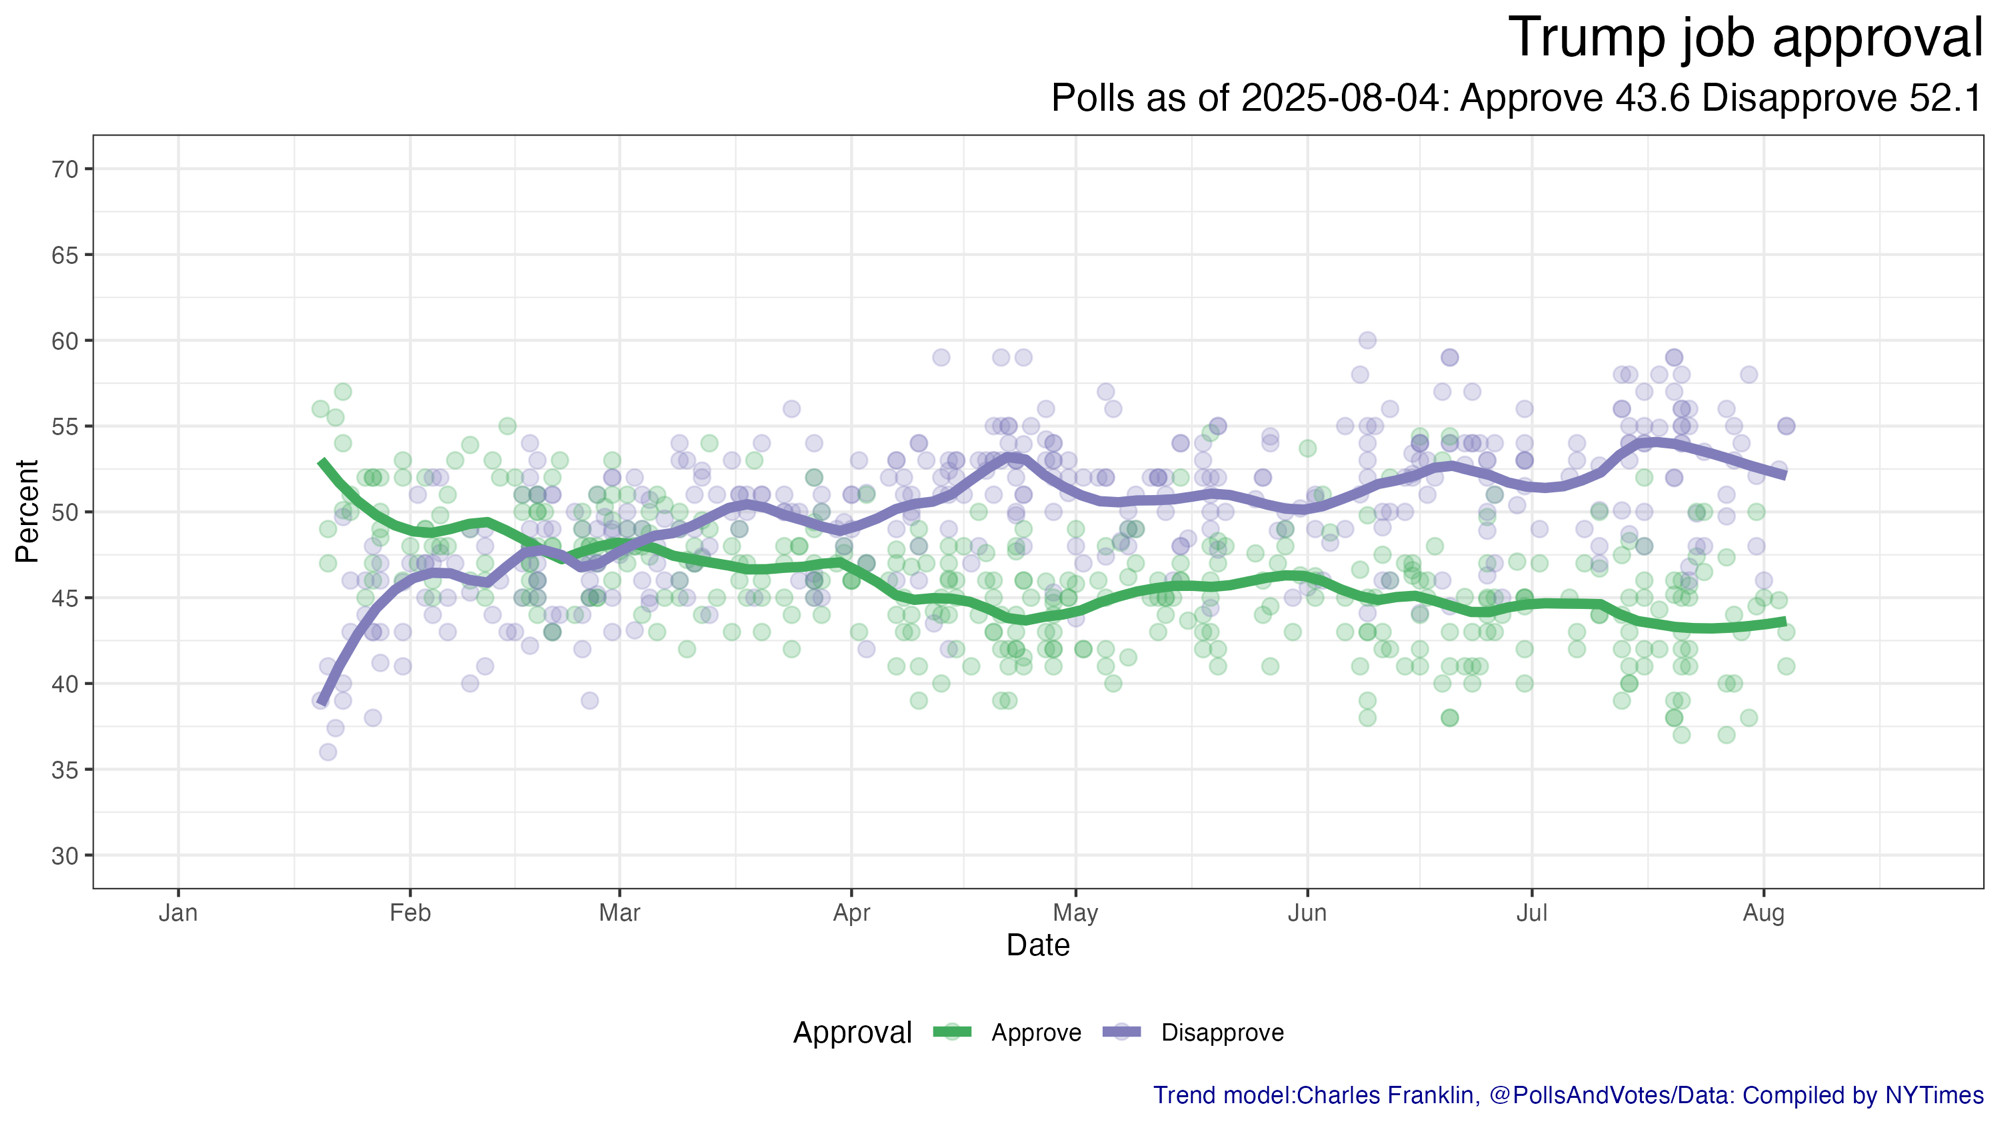
Reality check. Headlines describe Trump approval: "crashing", "record low", "major decline". These are driven by cherry picking single polls The polling average HAS shown a decline from Jan but nothing that justifies "crashing". Apr low, small recovery, recent slip Now 43.6-52.1

Chart shows steady decline in Trump approval but not sharp drops often described in headlines.

Replies

  1. Big picture I agree. But I notice there is a limited but significant difference between your chart here and those produced by NYT and Morris. Is that them applying a different filter/criteria for poll inclusion?

    1
  2. Does this include known crap pollsters like Rasmussen or Trafalgar? I don’t know why we should pay more attention to aggregates if they include terrible polls.

    1
  3. Headlines exaggerate. The reality is that he’s been steadily, and seriously, underwater for most of his term now.

    0
  4. Man, what are you talking about? This graph shows a pretty big decline! Here is a better view of the slope and scale and a comparison to Biden — who didn’t reach these lows until year 2!

    1
  5. "Folks, this is your captain. While the plane is unexpectedly descending at a fairly quick rate, I'd appreciate it if you please wouldn't say the plane is crashing."

    0
  6. He’s been scraping off his support floor for a long time. There would have to be a major crisis to go lower than this, IMO

    0