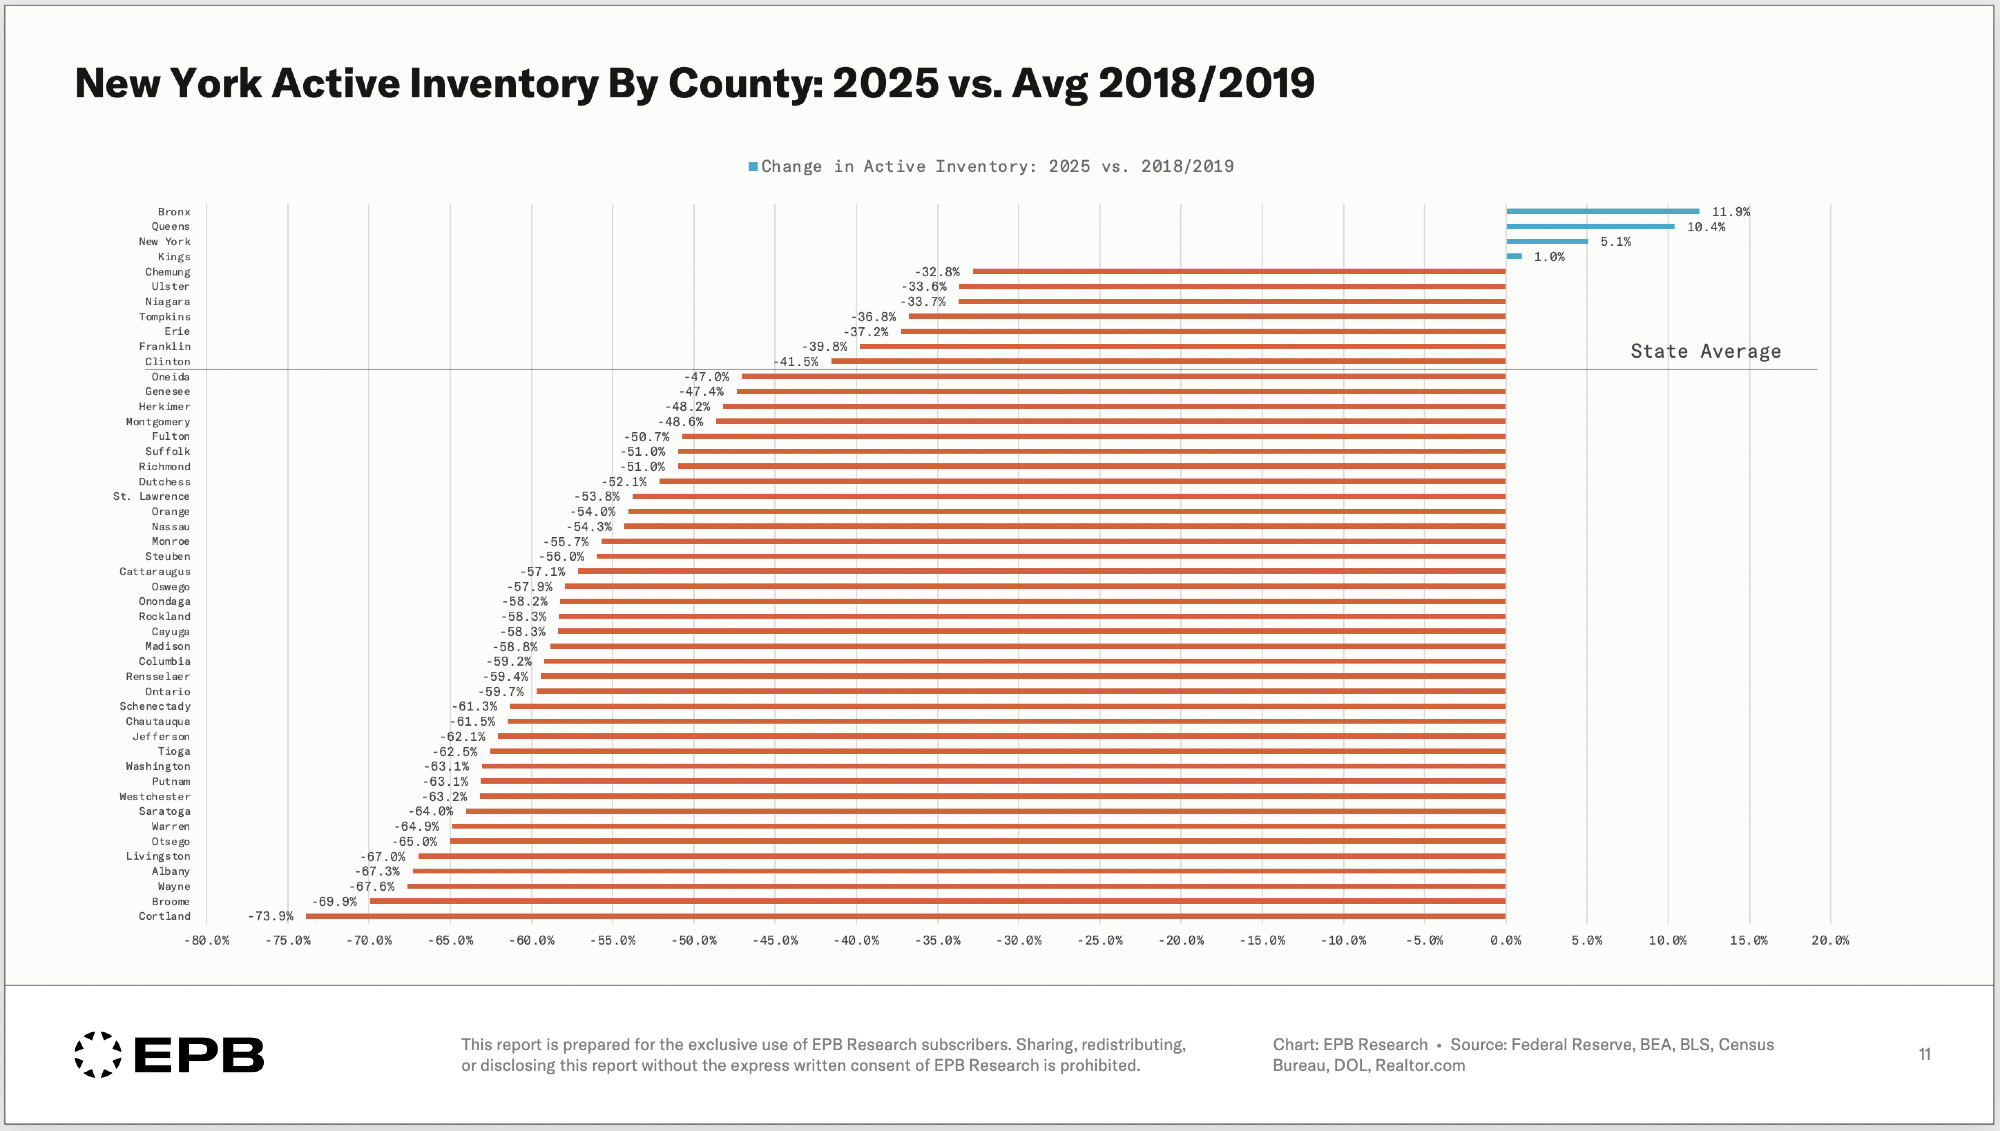
The housing inventory situation in New York is laughably bad.
Among the worst in the country.

1114 Followers
6 Following
The housing inventory situation in New York is laughably bad.
Among the worst in the country.
Thanks Mike!
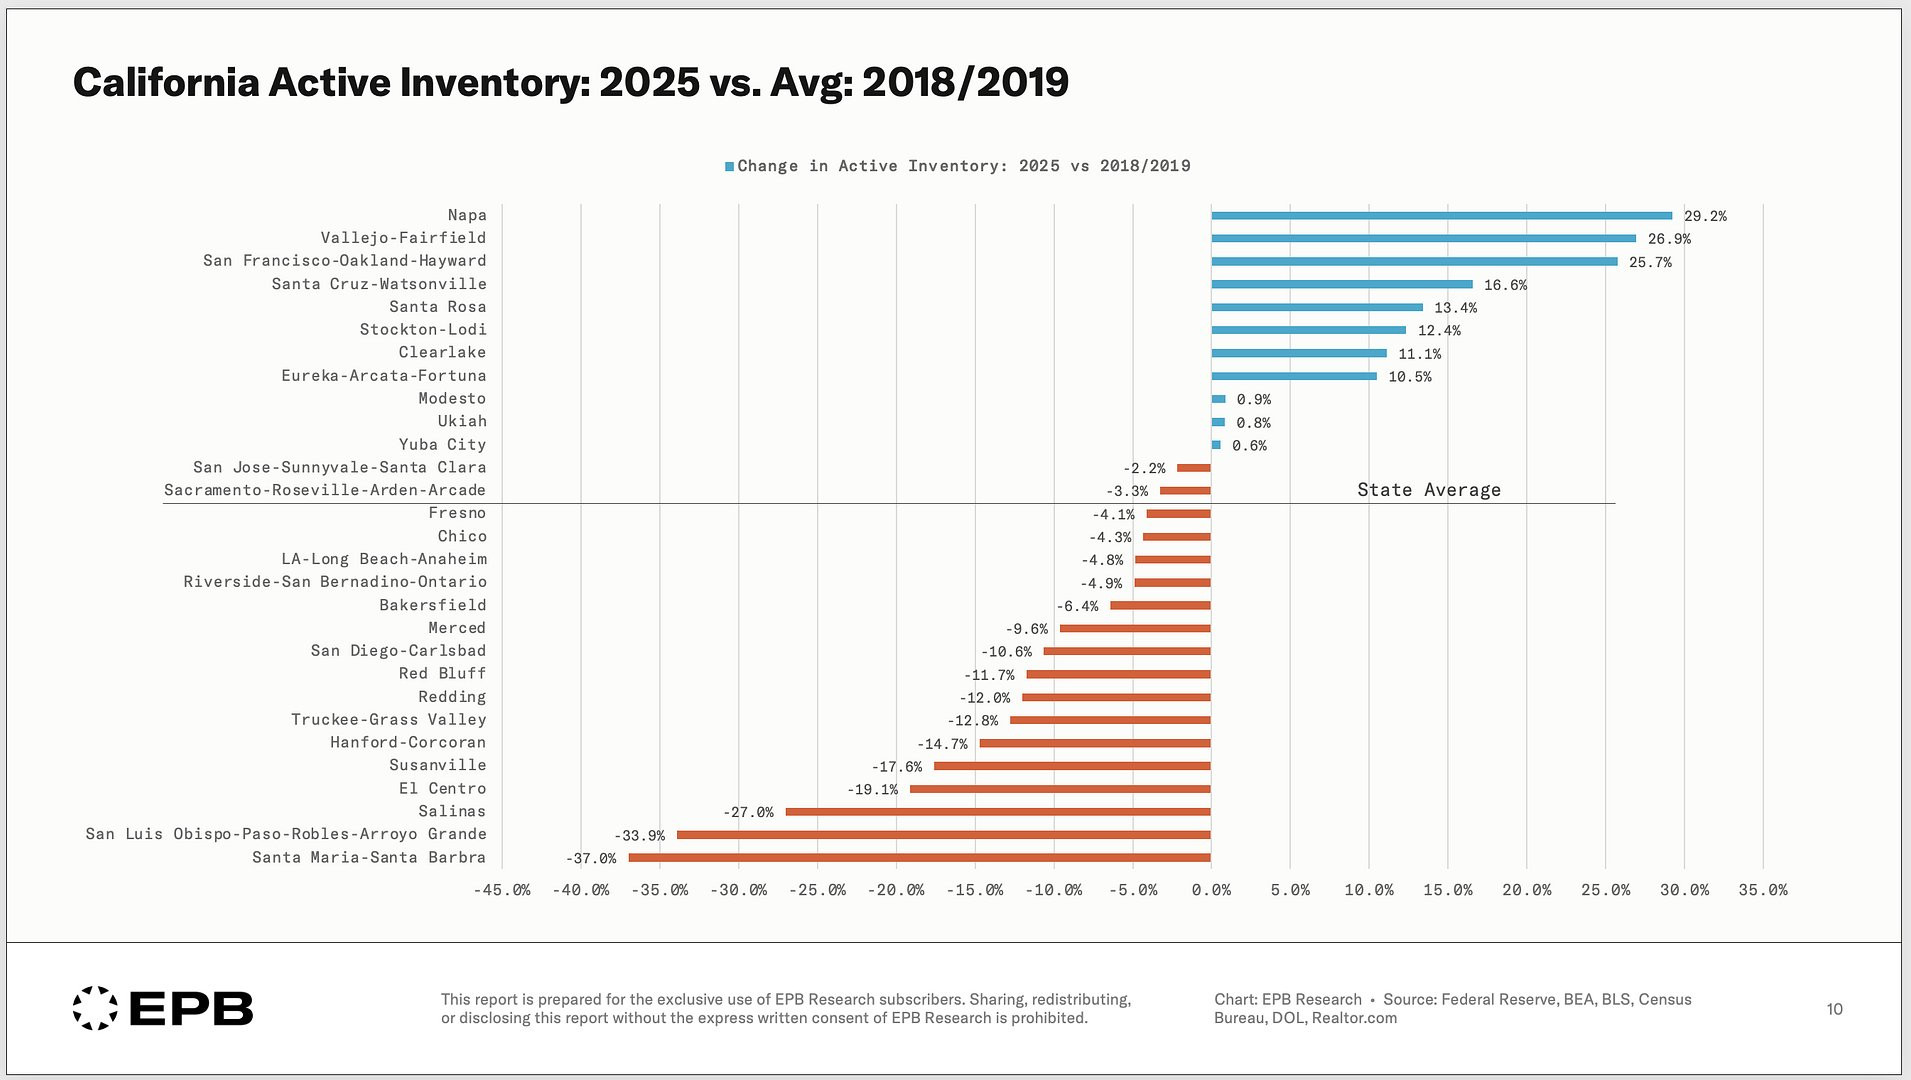
California has about 4% less active inventory in 2025 compared to pre-pandemic.
However, the inventory profile is very different across the state.
This chart breaks down the metro-level inventory data across California.
You can see which areas are better/worse than average.
We just released a new video update on residential construction & home prices.
It covers the full housing cycle & highlights major regional disparities in inventory & price trends.
If you're interested in reports like this, you can find more info here: epbresearch.com/services/
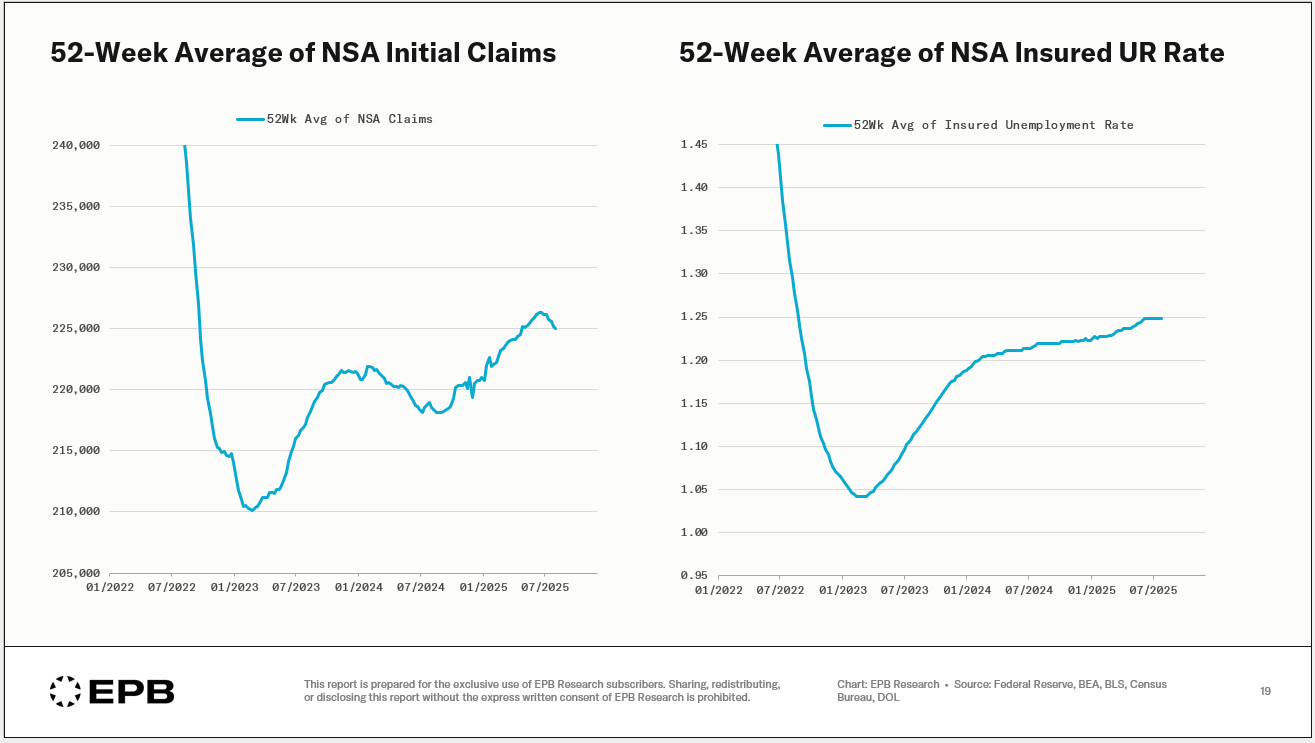
Initial jobless claims have been stabilizing over the last few weeks.
Less so for the insured UR rate.
Something important you probably missed in the last jobs report:
Construction and manufacturing employment just turned negative YoY, a classic recession signal.
Credit to @epbresearch.bsky.social for this, the kind of signal Alethia is built to highlight.
writings.alethia.news/cyclical-job...

You won’t find this chart in the headlines, but it might be the most important signal in last week’s employment report. Construction and manufacturing payrolls just turned negative year-over-year. Th...
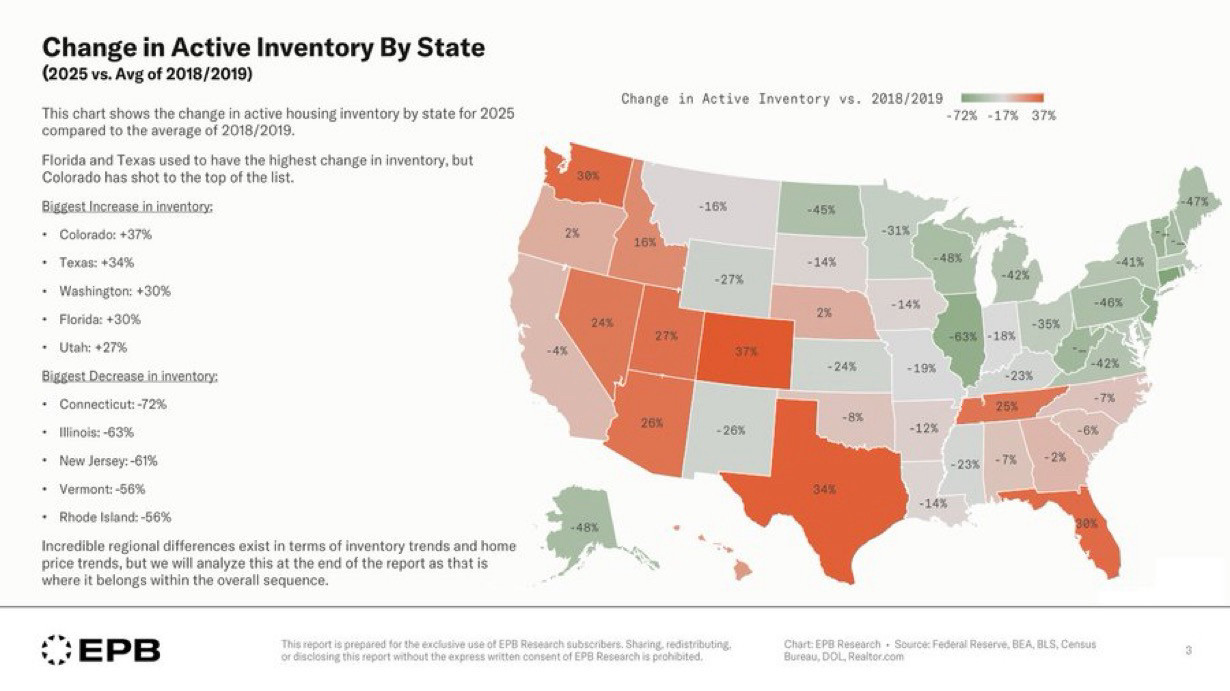
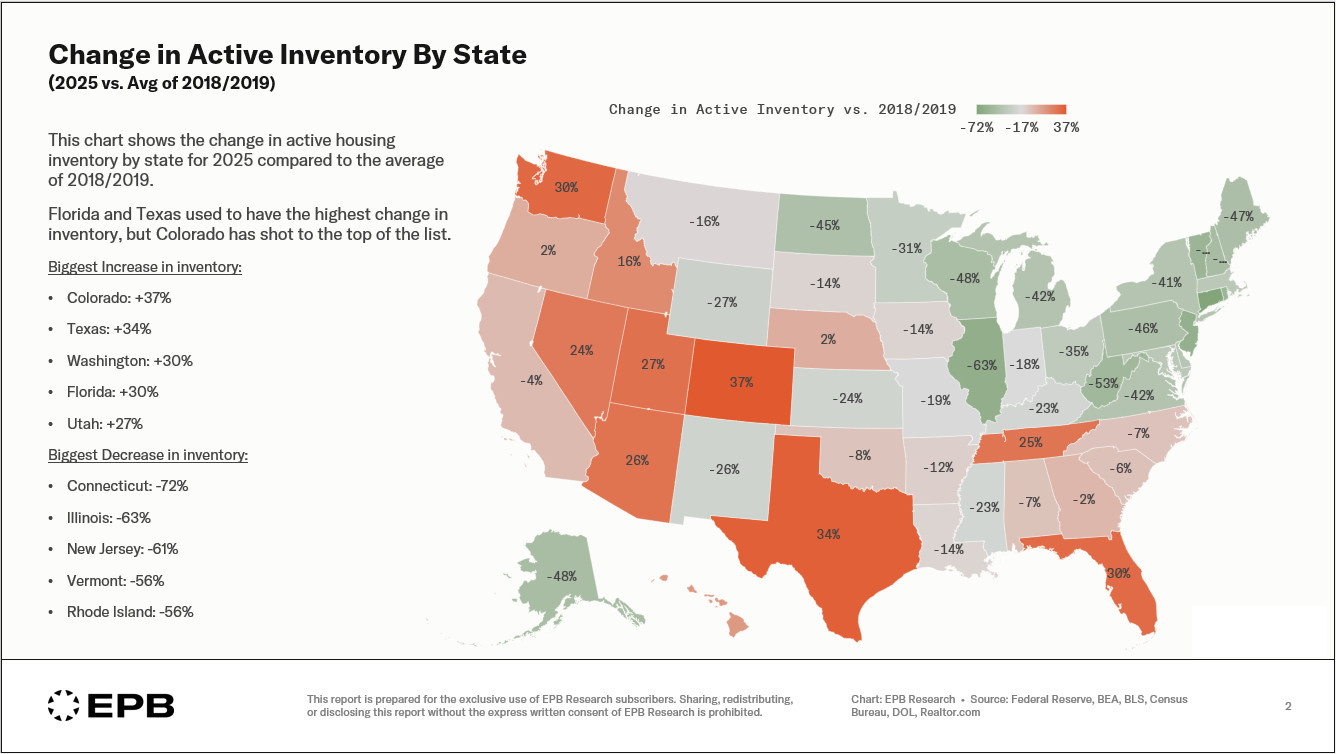
Our next EPB update focuses on residential construction and home prices.
This chart shows active housing inventory in 2025 compared to 2018/2019 levels.
This is the one of the largest variations in inventory and home prices by geography or region in history.
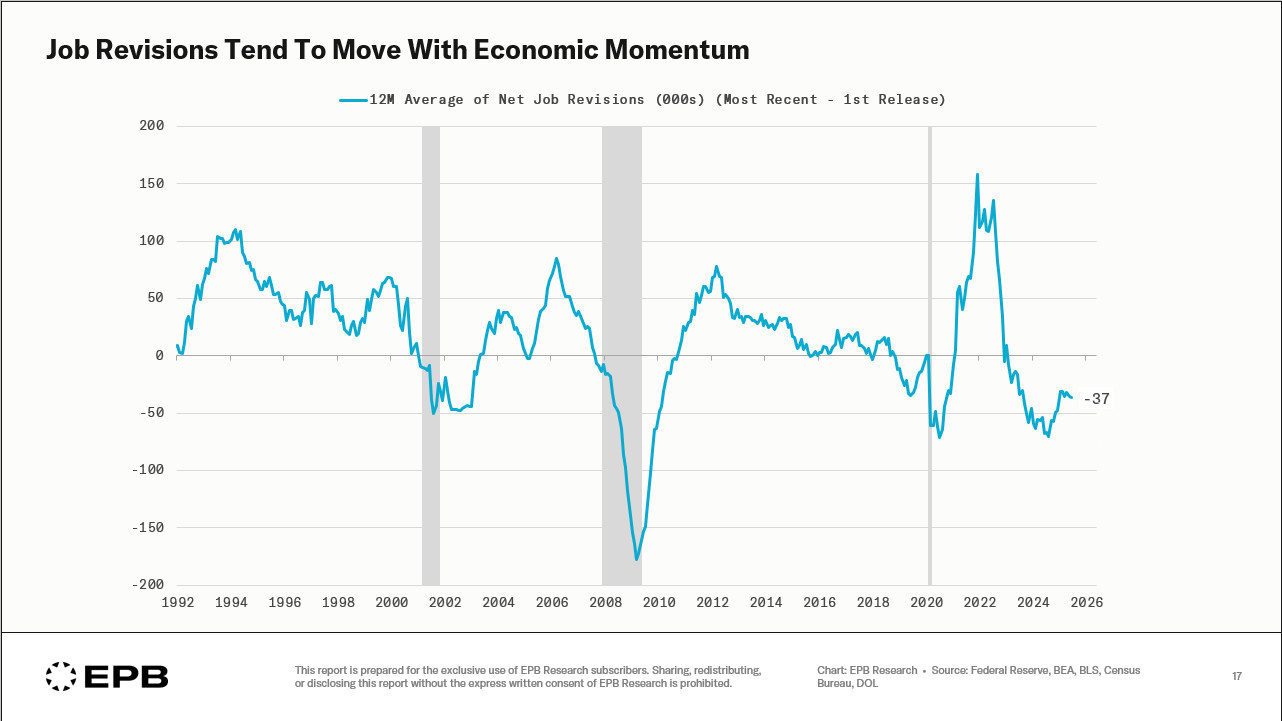
Two comments about the labor data and political noise surrounding revisions:
1] Establishment survey nonfarm payroll revisions tend to move with economic momentum (so much that rolling revisions look like an economic indicator)
2] The unemployment rate is much less revised.
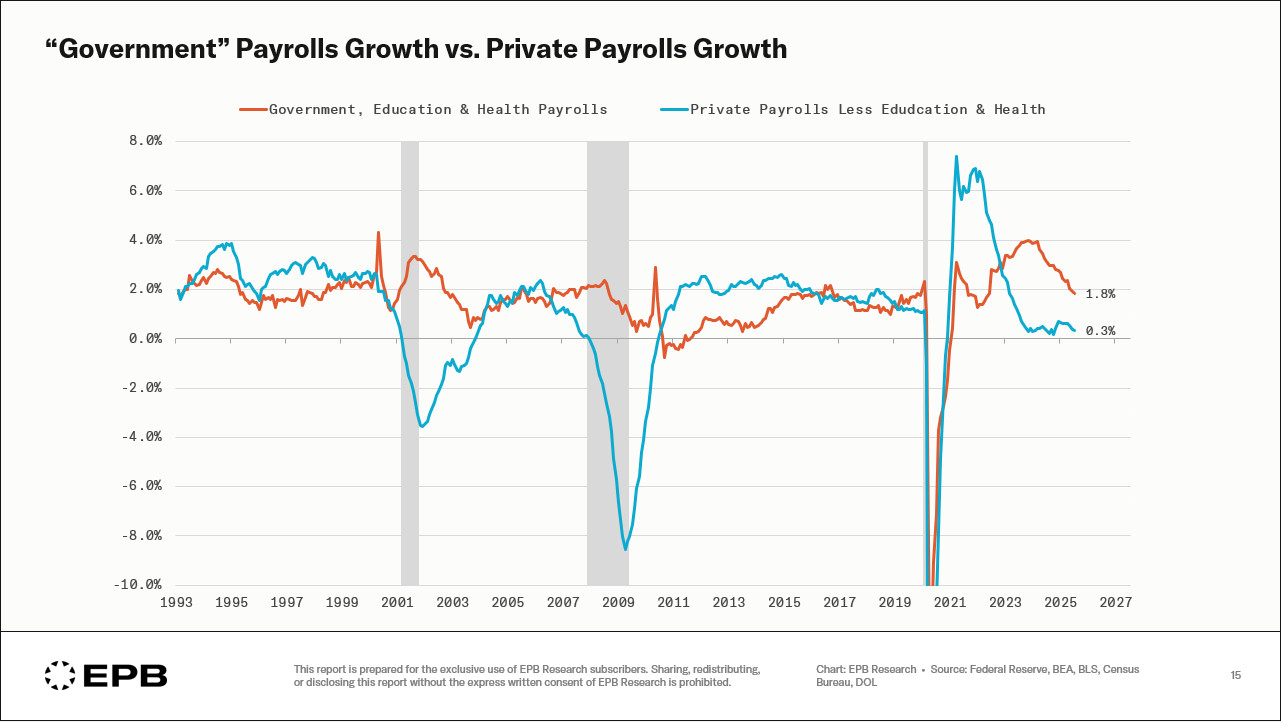
What is different this cycle is the length of time private jobs growth has held below 1% (25 straight months).
Unusual outside of recessionary periods.
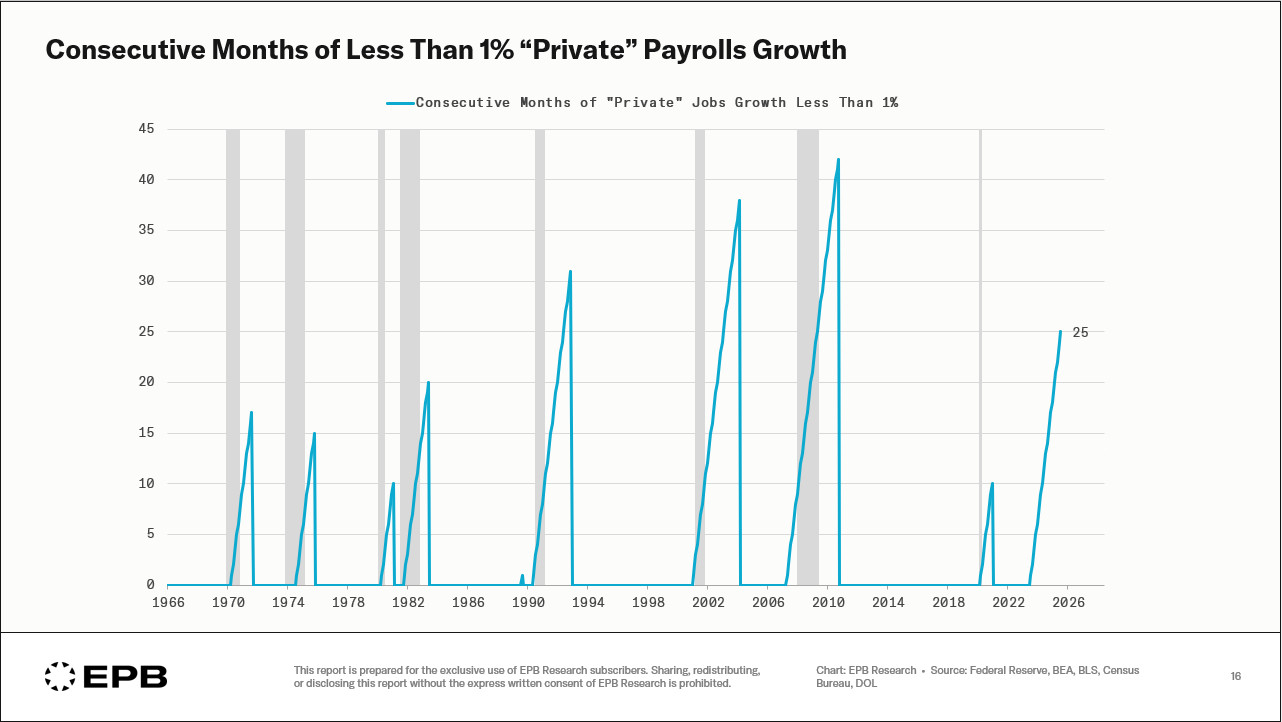
Government & quasi-government jobs (32% of total) are growing at 1.8%.
"Private" sector jobs (68% of total) are growing at 0.3%.
This split is textbook late-cycle labor dynamics.