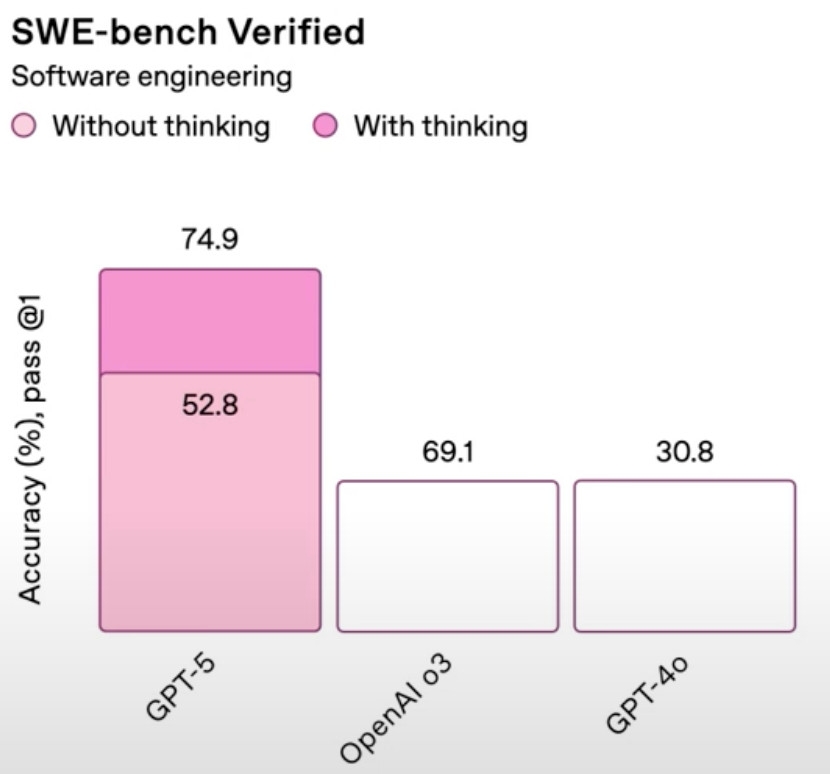
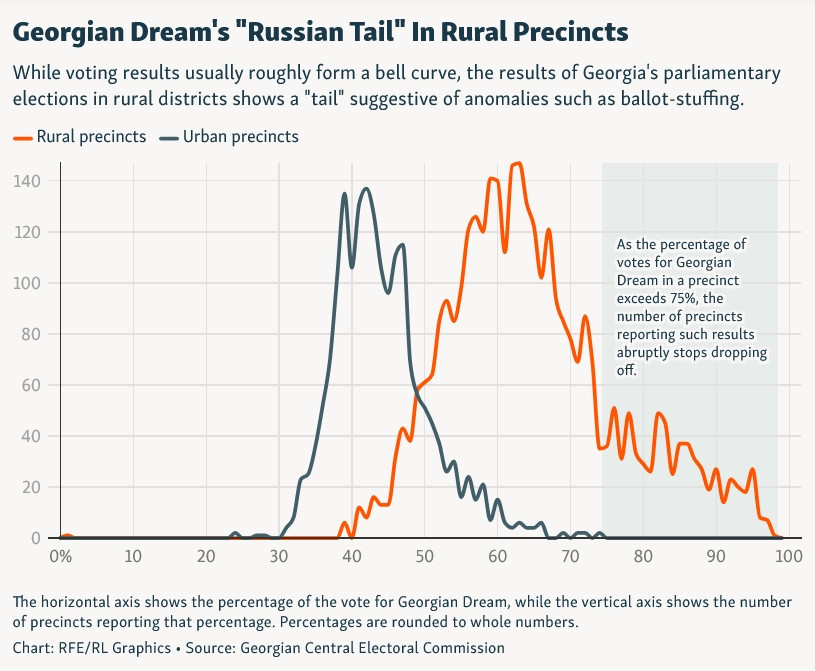
This is a parody of the actual (much worse) charts used in the announcement presentation.

25 Followers
20 Following
This is a parody of the actual (much worse) charts used in the announcement presentation.
Strongly related to toxic masculinity and "male loneliness epidemic".
Men have forgotten how to have friendships (or maybe the culture has forgotten that friendship is masculine), and incels are pouring gas on that fire.
Some loony ran for office and got 9 friends to say they voted for her when she only officially tallied 7.
That's not a scandal, it's a circus sideshow.
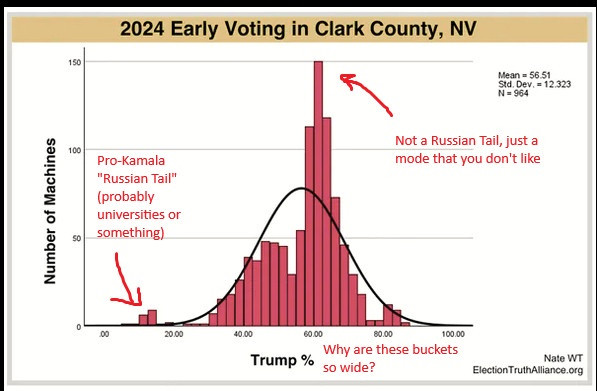
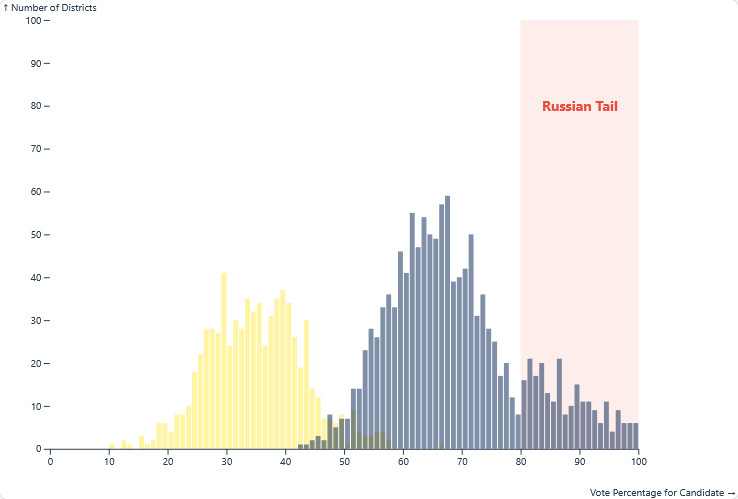
What part of "that's not what a Russian Tail looks like" don't you understand?
Elections aren't normally distributed. The original Udot analysis that invented the term "russian tail" is predicated on the fact that elections aren't normally distributed.
That's what I said? You aren't reading me, slow down.
None of the graphs have time in them.
You are the one who brought up time.
None of their graphs and none of my graphs have time on the x axis. There are no graphs anywhere with time on an x axis. You're mad about a thing that doesn't exist
Boy, sure is a good thing that there isn't a single chart in all of this that uses time on the x axis then, isn't it?
Can you at least try to make points that are whatsoever connected to the thing you're trying to criticize?
Really this is just telling me that you didn't read it, because on one reply you say "they're right because they used Udot's method" and on the other "they're right because they fitted a bell curve", when the ENTIRE POINT of Udot's method is that elections DON'T adhere to single bell curves.
Yeah, and that reason can be "the source distribution isn't a bell curve".
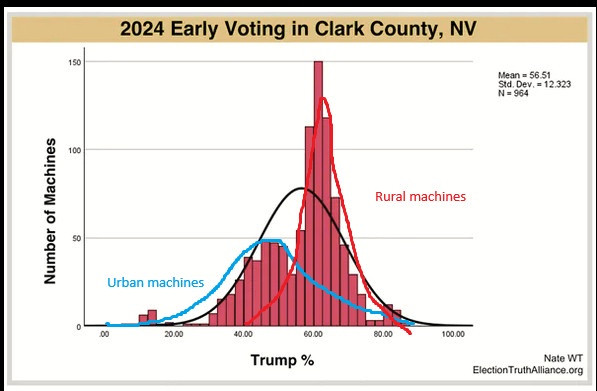
The Central Limit Theorem only holds when all samples are taken from the same source.
It is insane to expect that polling sites in central Vegas and a post office on top of a mountain should average to the same avg opinion
Read the site.
ETA are lying about how Udot's analysis works.
Elections are not unimodal and spikes are not tails.
This is a good question, and led to a little bit of bonus analysis! Click through to read the thread, it's not very long.
TLDR: the claim is false, and it's another instance where a smoking gun exists in the data and is easy to find but ETA didn't publish it because it disproves them.
Not sure if this is the same issue, but it was noted after the election that the swing states had many voters who selected trump at the top of the ballot, and Dems for the rest of the ballot. And that this only occurred in the swing states. Is there truth in this and does it point to corruption?