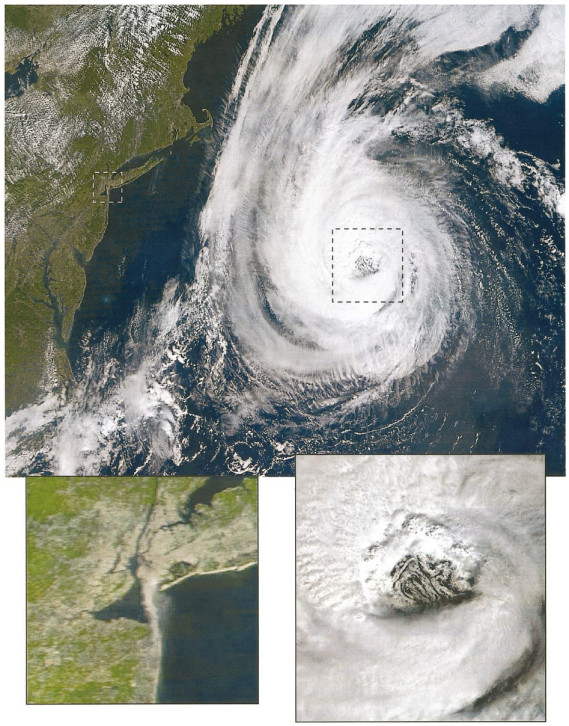
The 2001 image was featured as a "Picture of Month" in the Monthly Weather Review: journals.ametsoc.org/view/journal... [2/2]

12279 Followers
2060 Following
Univ. of Miami hurricane researcher 🌀 living in New Mexico 🏜. Husband and dog dad. 🏳️🌈 https://bmcnoldy.earth.miami.edu/
The 2001 image was featured as a "Picture of Month" in the Monthly Weather Review: journals.ametsoc.org/view/journal... [2/2]
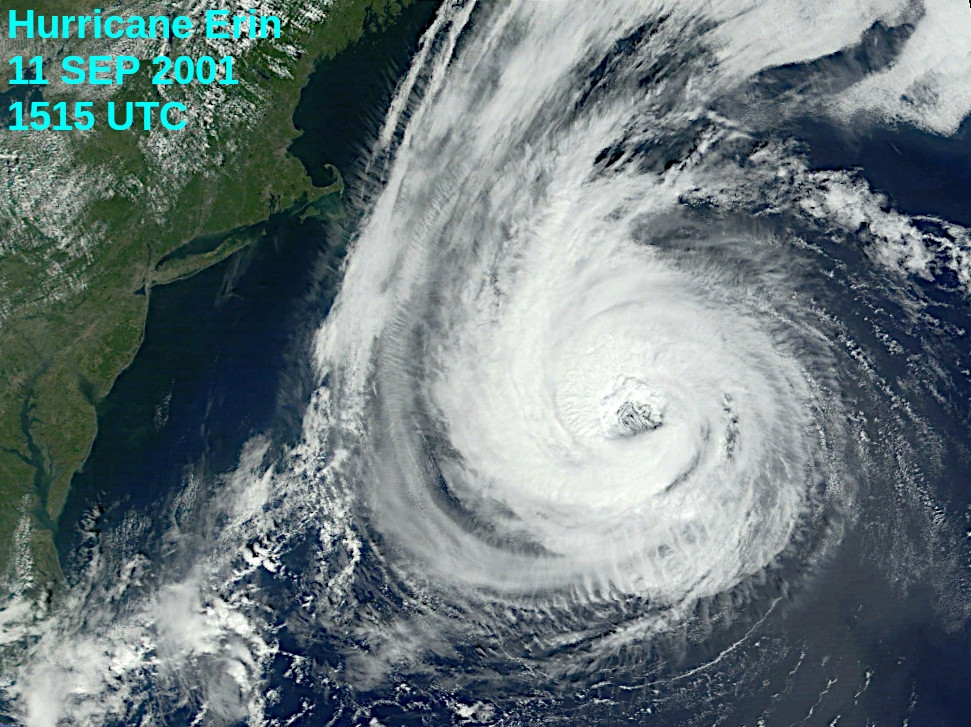
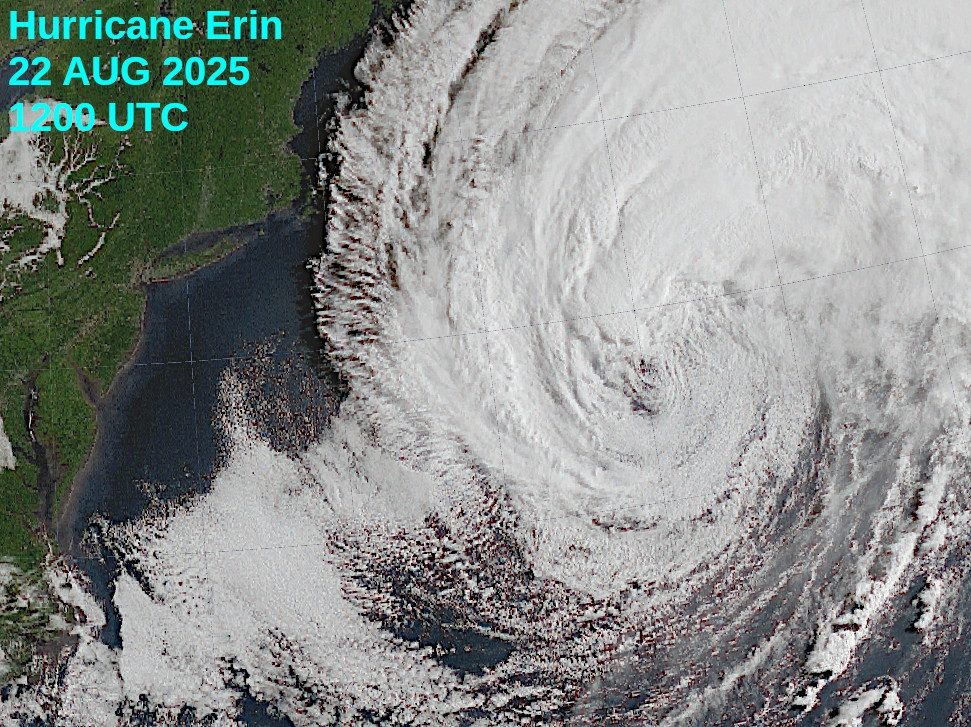
Right around 5am EDT on Friday, Hurricane #Erin 2025 passed over the same spot that Hurricane Erin 2001 was at on the infamous morning of September 11, 2001. Waiting for sunrise on it today, here's a comparison of the two storms at almost the same location. Amazing. [1/2]
en.wikipedia.org/wiki/Joanne_... earthobservatory.nasa.gov/features/Sim... I first met her in 1997 when I was an undergraduate intern in the NASA TRMM Office... and she was charming, curious, and enthusiastic. I'm thankful to have interacted with her a few times before she died in 2010. [2/2]

Joanne Simpson became the first woman Ph.D. meteorologist. She also pioneered studies of cloud models, hurricanes, weather modification, and guided the development of the Tropical Rainfall Measuring M...
Digging through emails on Erin, and accidentally stumbled across several messages from Joanne Simpson from 2002 (about Erin 2001)! One of the messages she sent to me has the subject "Your excellent paper on Hurricane Erin". 🤯 Things like that make you feel so tiny... she was/is a legend. [1/2]
There's often a lot of confusion over the "cone of uncertainty" in hurricane forecasts. I tried to break down here what it means--and perhaps more importantly, what it doesnt. 🧪
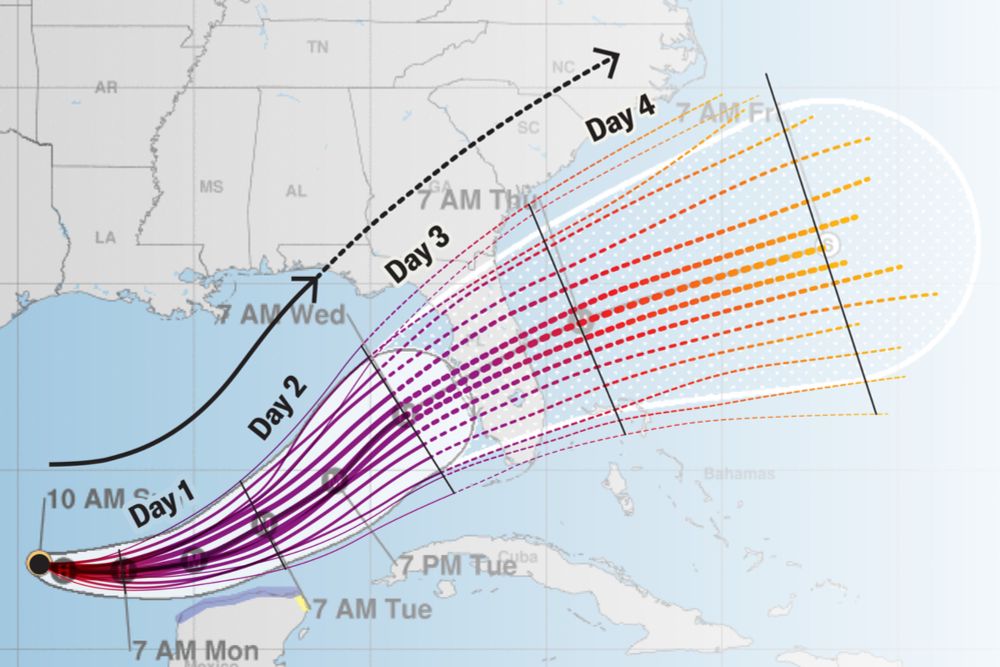
Hurricane forecasts feature a “cone of uncertainty,” but what is it actually showing? Scientific American breaks it down for you
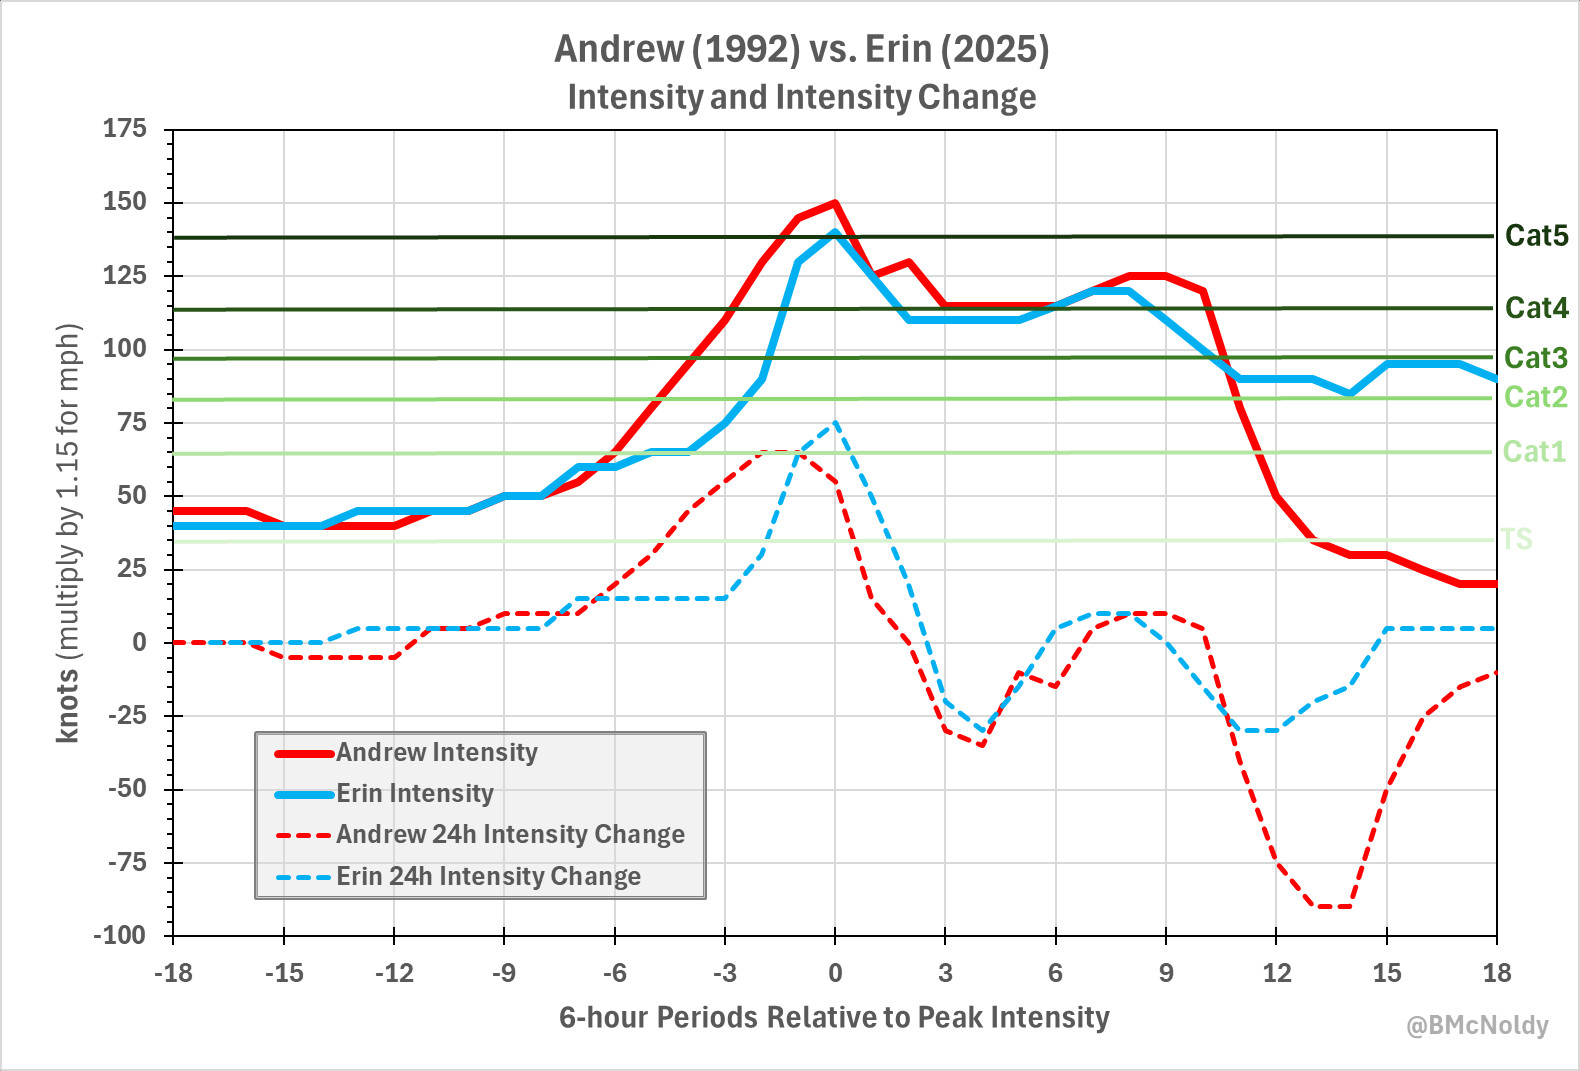
Andrew reached a higher peak intensity than Erin (150 kt vs 140 kt), but Erin had a higher peak rate of intensification (75 kt/24hr vs 65 kt/24hr). I added the Saffir-Simpson scale thresholds in green horizontal lines for the intensity.
[2/2]
Inspired by a comment by @tcblers.bsky.social, I took a deeper dive into the Andrew '92 and Erin '25 comparison. This chart has values plotted every 6 hours... the solid lines are the intensity, dashed lines are 24-hour intensity change. They are aligned with time=0 at their peak intensity.
[1/2]
Katrina was a Cat 5 over the central Gulf of Mexico, but weakened to a Cat 3 by the time it made landfall. bit.ly/4mqBaY2
NOAA Hurricane Tracks, NOAA Historical Hurricane Tracks, hurricane paths, hurricane history, hurricane database
I was a junior in high school, and was glued to The Weather Channel in Pennsylvania. So I wasn't there in person for it, but remember the evolution and aftermath very well from TV coverage.
I first shared this map and statistic in May 2019 (on Twitter, x.com/BMcNoldy/sta...) and it has become a very popular messaging tool to teach people to pay close attention... surprises can still happen.